


The two-child limit now affects almost one million children – and it is being implemented when poverty is rising for larger families
July 16, 2020
At the peak of the UK’s Covid-19 lockdown, the headlines were briefly captured by a ‘good news’ story: the Prime Minister had had another child. While we don’t know exactly how many children Boris Johnson now has, we do know it is more than two – the number above which some families start to be affected by the two-child limit.
This week, the UK Government published its annual statistics on the number of households affected by this policy, which restricts support through tax credits and Universal Credit to the first two children in a family. Because it only affects families with a third or subsequent child born on or after April 6 2017, the policy did not come in with a big and noticeable bang – its impact was felt by only a relatively small number of families in its first year. But its reach is growing steadily over time. The new figures show that 911,000 children now live in affected households. The majority (59%) of those households contain three children.
The two-child limit, a unique move among European welfare states, was introduced with the official aim of ensuring that families receiving benefits should “face the same financial choices about having children as those supporting themselves solely through work”. In practice, in-work as well as out-of-work benefits are affected, so the constraint affects those in low paid jobs as well as those not currently in employment. Strikingly, the statistics released by the Government this week show that nearly three in five households affected by the policy are households where adults are working.
For all families affected, the two-child limit means a reduction in support of £53.50 per week for each child who does not qualify, when compared to what they would have received before the policy. This is a substantial sum of money for any family, but especially for those struggling to get by on a low income. It might mean the difference between the odd day trip out or treat for a child. It might mean having to carefully measure out every last pence and pound and still find oneself unable to meet the costs of basic essentials.
Our ongoing research for the Nuffield Foundation will seek to capture the impact on the well-being of families and children affected, using both interviews with families and analysis of large-scale datasets. What we already know, however, is that when the two-child limit was introduced levels of poverty were already on the rise in larger families. Figure 1 shows what happened to poverty after housing costs for children in families that are ‘smaller’ (1-2 children) and ‘larger’ (3+ children), going back to the late 1990s. After two periods which recorded substantial falls, in the early and later 2000s, poverty in larger families started to rise from 2012/13. So far we only have poverty estimates up to April 2019, and there is little sign of an impact in the data so far, likely because relatively few families (around 160,000) had been affected by that point.
Figure 1 Percentage of children living in poverty (below 60% median equivalised income after housing costs), by the number of children in the family
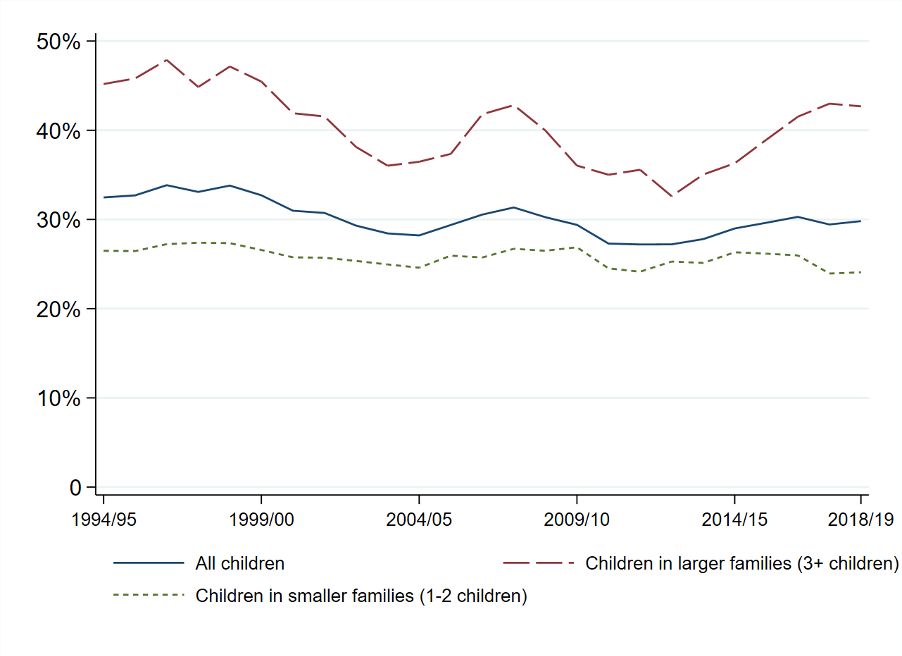
Source: Authors’ calculations from the Households Below Average Income dataset, 14th edition.
Why had poverty risen for larger families even before the two-child limit came in? The answer lies in previous welfare reforms introduced as part of austerity measures under the Coalition and the Cameron-Osborne Conservative administration. These were not specifically targeted at low income families with children, although there were some specific cuts to more universal support for families with a baby, and the tax credit system was changed to become more tightly targeted on lower income households. But more general cuts and reforms affected families with children among others – and indeed affected them more than many others.
One key change felt by households in receipt of working-age benefits was the benefit freeze. For five years from 2015-2020 benefits did not rise in line with inflation, as is the standard, but remained the same in cash terms, meaning a real cut in value each time prices rose – a 6% cut over this period from this one policy alone. While this was not a policy directly targeted at families with three or more children, it hit this group hardest, because benefits constitute a higher share of total income for these households than for many others. This should not surprise anyone. It is something we have understood since the days of Seebohm Rowntree’soriginal surveys of poverty in Britain, more than 100 years ago: it is when households have children at home that they are most in need of state support. In this phase, wages have to stretch further – more food, more shoes and clothes, more school trips. At the same time work intensity often reduces – one parent may work part-time or not at all to manage caring responsibilities. So any policy that hits state support in general is likely to be felt most keenly by those with dependent children.
The government has argued that policies that cut state financial support encourage people to move into work and increase their hours. In addition, the Conservatives significantly raised the national minimum wage alongside benefit cuts. Parental employment rates did indeed rise during this period, and our own analysis suggests this was also true in larger families. But as Figure 2 shows, while the risk of poverty remains much lower if someone in the household is working, employment is becoming less rather than more reliable as a route out of poverty for larger families. Poverty rates have risen for children in larger families since 2012, whether or not their parents were working. The increases in employment and minimum wages have not been enough to offset the cuts in support for families that have greater needs.
Figure 2 The rate of poverty in larger families (3+ children), by the work status of the adults in the household (three year moving average)
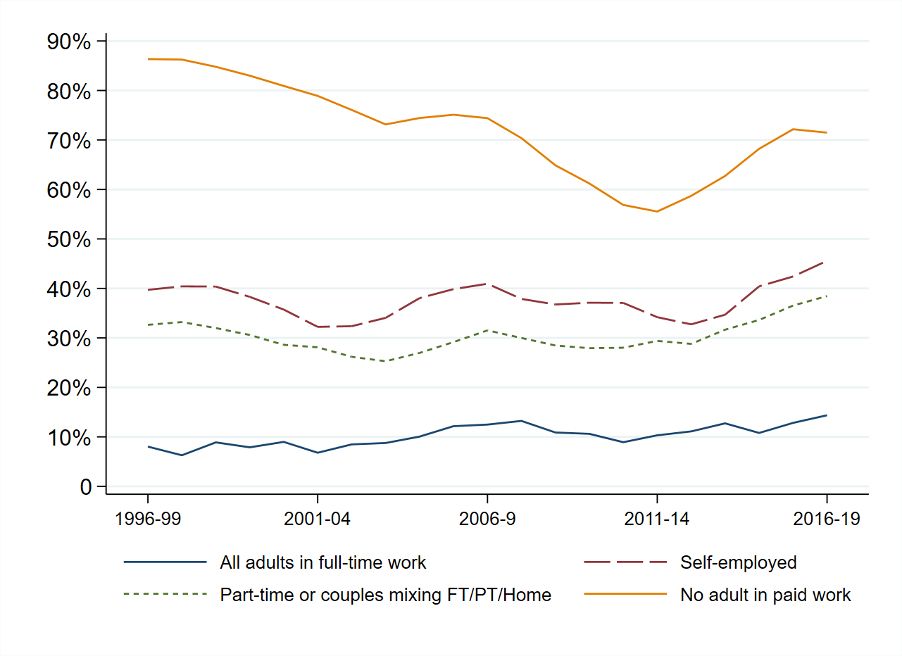
Source: Authors’ calculations from the Households Below Average Income dataset, 14th edition. Poverty rates have been calculated as a three-year moving average because of relatively small sample sizes.
Perhaps the government really believe that only families rich enough to be confident that they will never need to rely on state support should have more than two children. Perhaps there are many who agree with them. This means only parents who can access high paid jobs and who also have sufficient savings or private income sources to provide a buffer if things go wrong, or the confidence that their wider family could support them if necessary. Persistent wage inequalities mean more than one in three children in larger families where at least one parent is working currently live below the poverty line. Further, things can and do go wrong for reasons well beyond individuals’ control – as the Covid19 pandemic and lockdown have illustrated more clearly than any other event in our lifetimes. Because of the pandemic, many families will be experiencing sudden income shocks, and some will have become subject to the two-child limit for the first time.
The Prime Minister is one of several members of the current Cabinet who have larger families. We will never be in a situation where the majority of households face “the same financial choices” in planning their families that these individuals did. But we could be a society in which a nurse or a teacher without private wealth behind them can make decisions about family size safe in the knowledge that the social security system is there as a safety net should they need it. Each year that the two-child limit remains in place moves us further from being such a society.